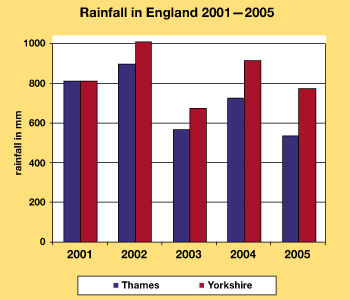
This bar chart shows the rainfall in two areas of England from 2001 to 2005.
The key shows what part of the country each colour represents.
In which year was the rainfall about the same in both parts of the country? Type your answer in the box.
This bar chart shows the rainfall in two areas of England from 2001 to 2005.
The key shows what part of the country each colour represents.
In which year was the rainfall about the same in both parts of the country? Type your answer in the box.
